Understand global liquidity.
Faster and with more clarity.
LiquidityPulse brings together key liquidity, market, and stress signals in one clear app so you can spot trends, regime shifts, and historical relationships faster.
What LiquidityPulse shows
The app compresses important macro and market indicators into a few clear working areas.
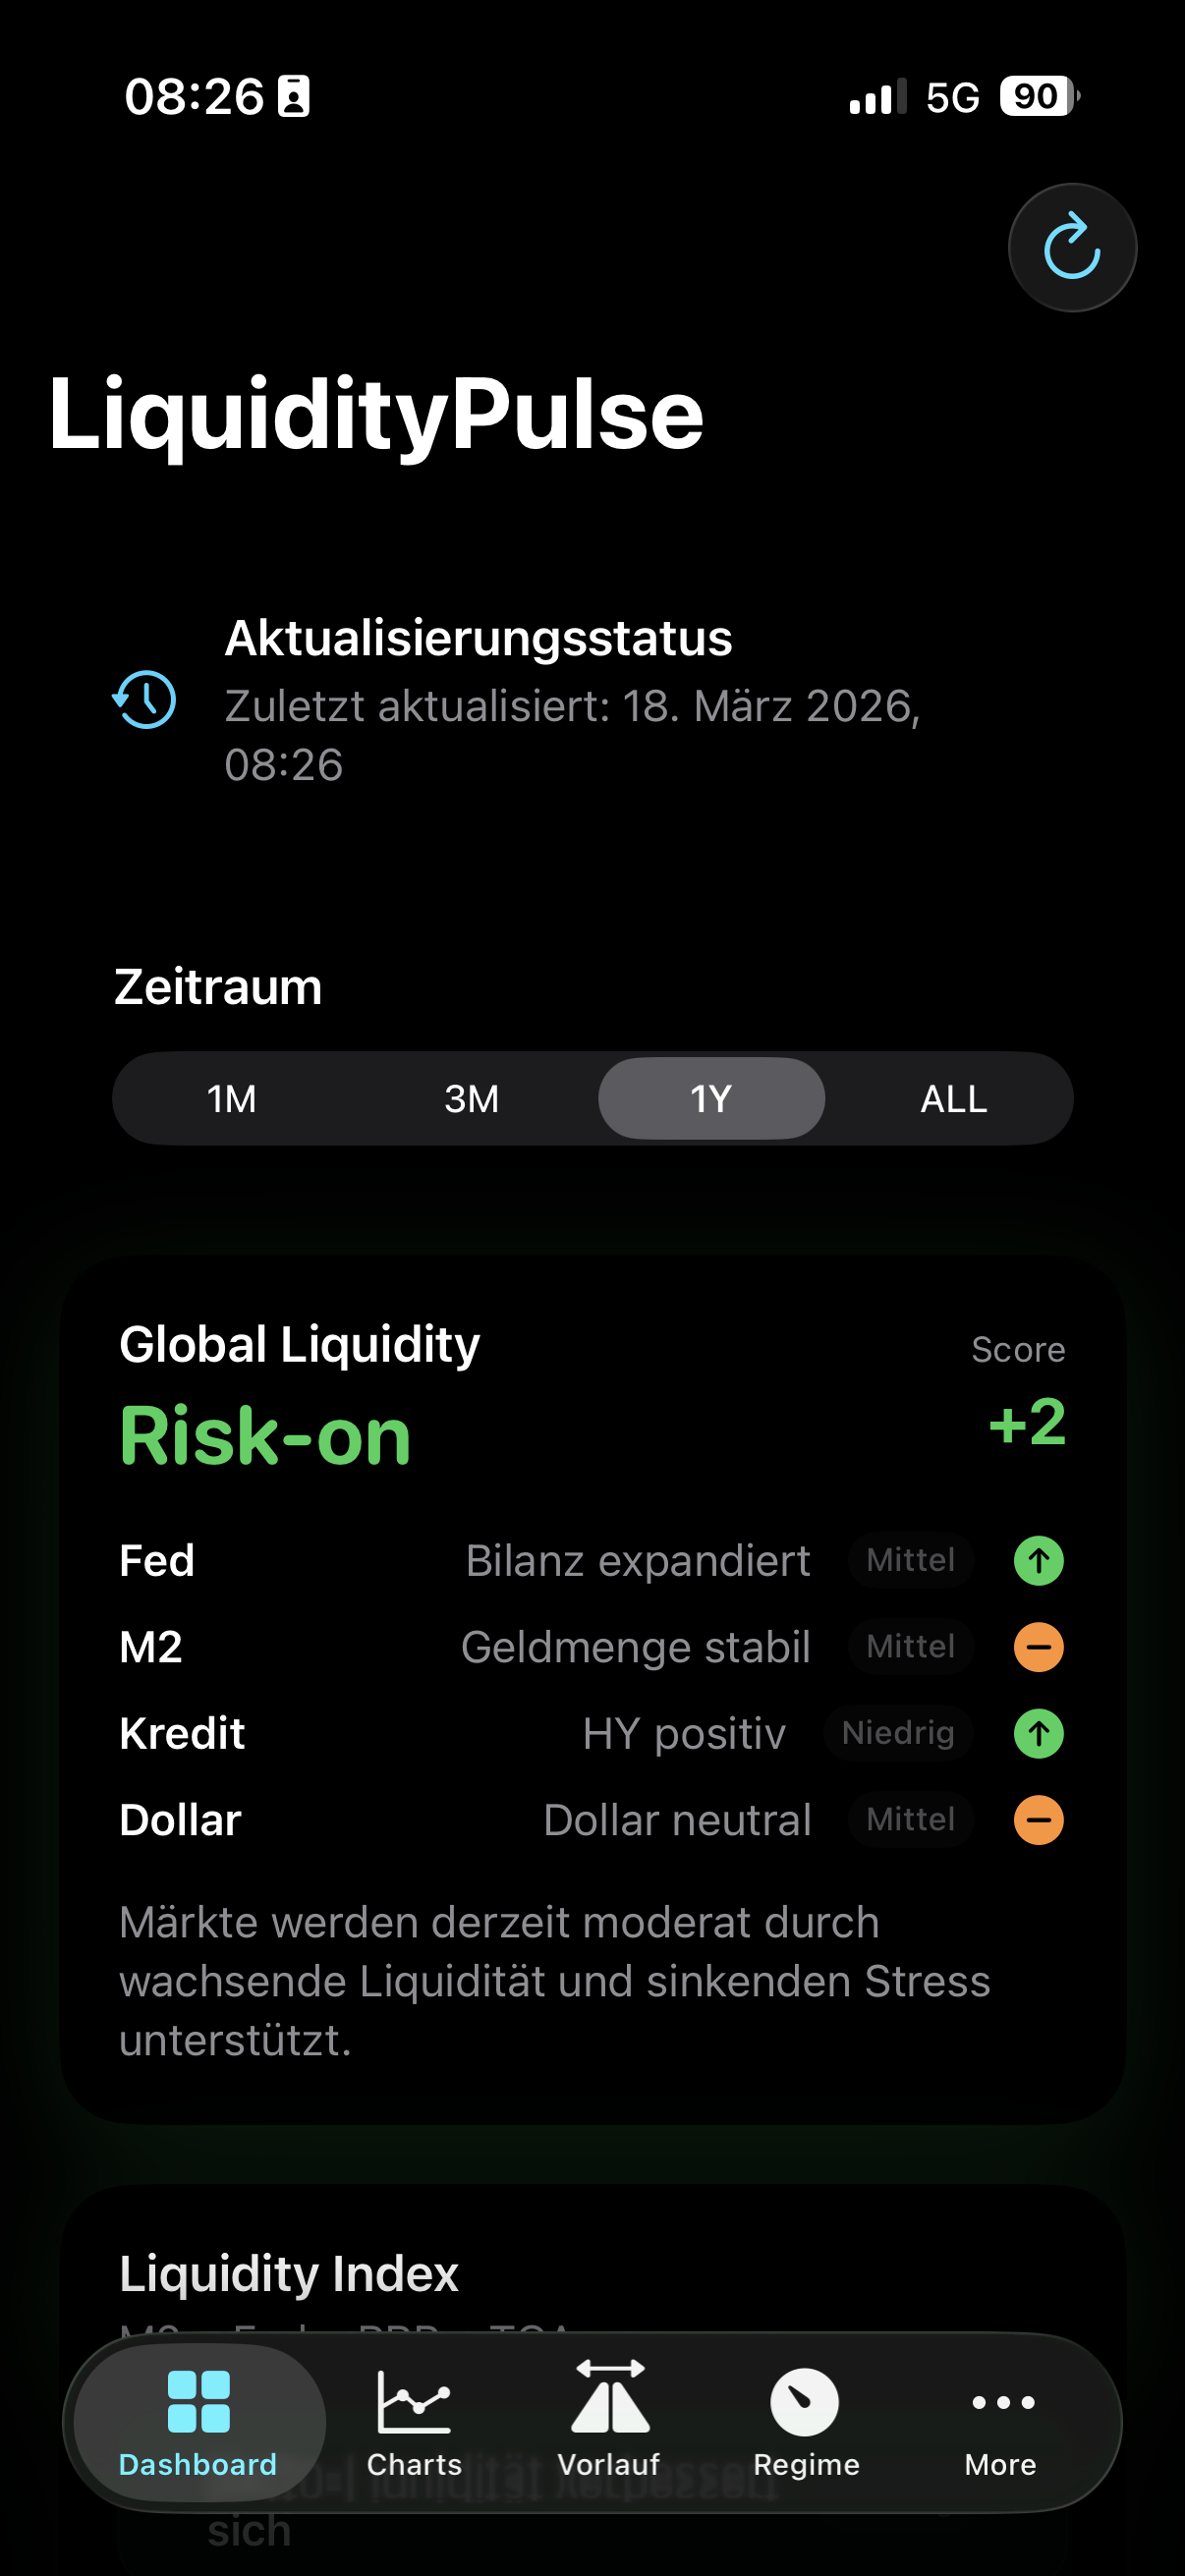
Dashboard
Scan the main liquidity, market, and stress blocks in one compact overview.
Charts & Lead/Lag
Compare time series, explore historical lead-lag behavior, and inspect signals in more detail.
Regime
A condensed regime view helps you classify supportive, neutral, or defensive market phases faster.
See it in action
Watch how LiquidityPulse turns complex macro and liquidity data into clear, actionable context — in under a minute.
- Global liquidity signals at a glance
- Regime classification in seconds
- Sector rotation and lead-lag made visible
Inside the app
A quick look at the most important areas inside LiquidityPulse.
Key data inputs
LiquidityPulse works with public market and macro data and presents them in a readable way.
Liquidity and macro signals
The analysis includes M2, the Fed balance sheet, Reverse Repo, Treasury General Account, SOFR, the US 10Y yield, the dollar index, and credit spreads.
Market context
Market indicators such as Bitcoin are also included to make historical relationships between liquidity, risk appetite, and price action easier to see.
Important notes
The app is meant to support interpretation, not make decisions for you.
Not investment advice
LiquidityPulse shows historical data, relationships, and signals. The content is intended for information and analysis support.
Correlation is not causation
Lead-lag views can reveal timing relationships. They are not hard forecasts and not proof of cause and effect.